How to embed charts with MJML
This tutorial describes how to use mjml-chartjs, an open-source custom component for MJML that allows you to create responsive charts in your HTML emails.
Prerequisites
Before starting this tutorial, please ensure that you have the following software installed on your computer:
- Node.js (version 10 or higher)
- NPM (version 6 or higher)
Getting Started
- First, let's create a new folder for our project and navigate to it in the terminal:
mkdir mjml-chartjs-tutorial
cd mjml-chartjs-tutorial
- Next, initialize a new NPM project and install the required dependencies:
npm init -y
npm install mjml mjml-chart mjml-chartjs
- Create a new file called
email.mjml:
touch email.mjml
- Open
email.mjmlin your favorite code editor and add the following basic MJML structure:
<mjml>
  <mj-head>
    <mj-title>MJML-ChartJS Tutorial</mj-title>
  </mj-head>
  <mj-body>
    <!-- layout code will go here -->
  </mj-body>
</mjml>
Creating a Chart with MJML-ChartJS
Now that we've set up our project, let's create a simple bar chart using mjml-chartjs.
- First, add the following code inside the
<mj-body>tag:
<mj-section>
  <mj-column>
    <mj-text font-size="20px" font-weight="bold">Sales Report</mj-text>
    <!-- chart goes here -->
  </mj-column>
</mj-section>
This code creates a new section with a column containing a title and an empty bar chart.
- Now we need to configure the chart data and options. Create an
<mj-chartjs>tag that contains your Chart.js configuration.
<mj-chartjs
  chart="{
  type: 'bar',
  data: {
    labels: ['Q1', 'Q2', 'Q3', 'Q4'],
    datasets: [{
      label: 'Users',
      data: [50, 60, 70, 180],
      backgroundColor: 'rgb(75, 192, 192)',
    }]
  }
}
"
/>
- Finally, let's compile the MJML file into HTML. Create a new file called
build.js:
touch build.js
- Open
build.jsin your code editor and add the following code:
const fs = require('fs');
const mjml = require('mjml');
const { registerComponent } = require('mjml-core');
const MjChartJs = require('mjml-chartjs');

registerComponent(MjChartJs);

const inputMJML = fs.readFileSync('./email.mjml', 'utf8');
const outputHTML = mjml(inputMJML, { minify: true }).html;

fs.writeFileSync('./email.html', outputHTML);
- Run the build script to generate the HTML file:
node build.js
- Open
email.htmlin your browser to see the rendered chart.
Chart parameters
The mj-chartjs component supports all the regular attributes of the mj-image tag, such as alt, href, width, and height (see mj-image docs). You can use these attributes to control size and positioning.
The component also supports the following chart-specific attributes:
| Name | Description | Required? | Default |
|---|---|---|---|
| chart | The Chart.js configuration to be rendered | Yes | |
| width | The pixel width of the generated chart image | 500px | |
| height | The pixel height of the generated chart image | 300px | |
| background-color | The background color of the generated chart image | #fff | |
| chartjs-version | The version of Chart.js renderer to use | 3 | |
| host | The host of the chart rendering server | quickchart.io | |
| scheme | The scheme of the chart rendering server | https | |
| ignore-url-limit | If set, ignore the 16kb URL length guideline | false | |
| api-key | QuickChart.io API key (optional, for signing requests) | ||
| api-account | QuickChart.io account ID (optional, for signing requests) |
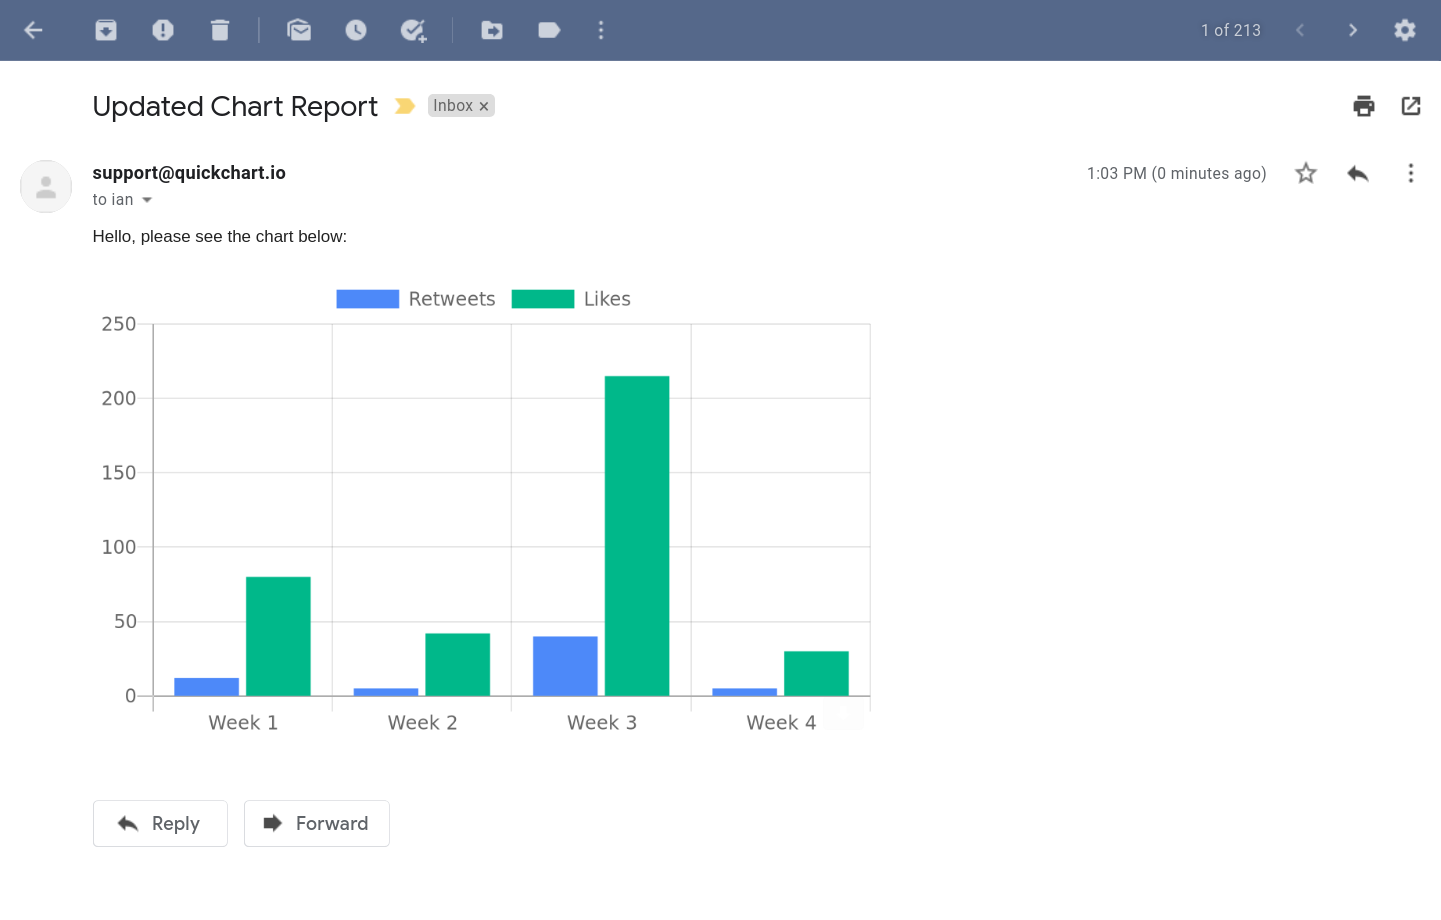
Conclusion
That's it! You've successfully created a responsive chart using mjml-chartjs. You can now customize the chart by modifying the data and options attributes, or by exploring other chart types supported by Chart.js.
Please feel free to reach out with any new ideas or questions! Also, if you need help, check out our community where we discuss QuickChart integrations, chart configurations, and more.
