Generating Charts in Google Apps Script
QuickChart is a web service that allows you to generate chart images and embed them nearly anywhere. You can use QuickChart from Google Apps Script in order to insert chart images in docs, spreadsheets, presentations, and more.
Before you get started with Google Apps Script, you may also be interested in how to integrate directly with Google Sheets. You may not need Apps Script or a custom function to accomplish your goals.
Creating a custom function
Here's an example of a Google Sheets custom function that returns a chart URL:
function GetChartUrl(values) {
  // Check if values are not provided or the array is empty
  if (!values || values.length === 0 || values[0].length === 0) {
    throw new Error('This function requires a range with multiple values');
  }
  Logger.log('Values:', values);

  // Flatten the 2D array values to a 1D array
  var flatValues = values.map(function(row) { return row[0]; });
  Logger.log('Flat Values:', flatValues);

  var width = 500;
  var height = 300;
  var backgroundColor = 'white';
  var config = {
    type: 'bar',
    data: {
      labels: ['Q1', 'Q2', 'Q3', 'Q4'],
      datasets: [{
        label: 'Data',
        data: flatValues
      }]
    },
    options: {
      backgroundColor: backgroundColor
    }
  };

  var configString = JSON.stringify(config);
  return `https://quickchart.io/chart?c=${encodeURIComponent(configString)}&w=${width}&h=${height}&bkg=${backgroundColor}&devicePixelRatio=1`;
}
After editing the script, remember to save it!
Now that your custom function is setup, use the formula in Google Sheets:
=GetChartUrl(A2:A6)
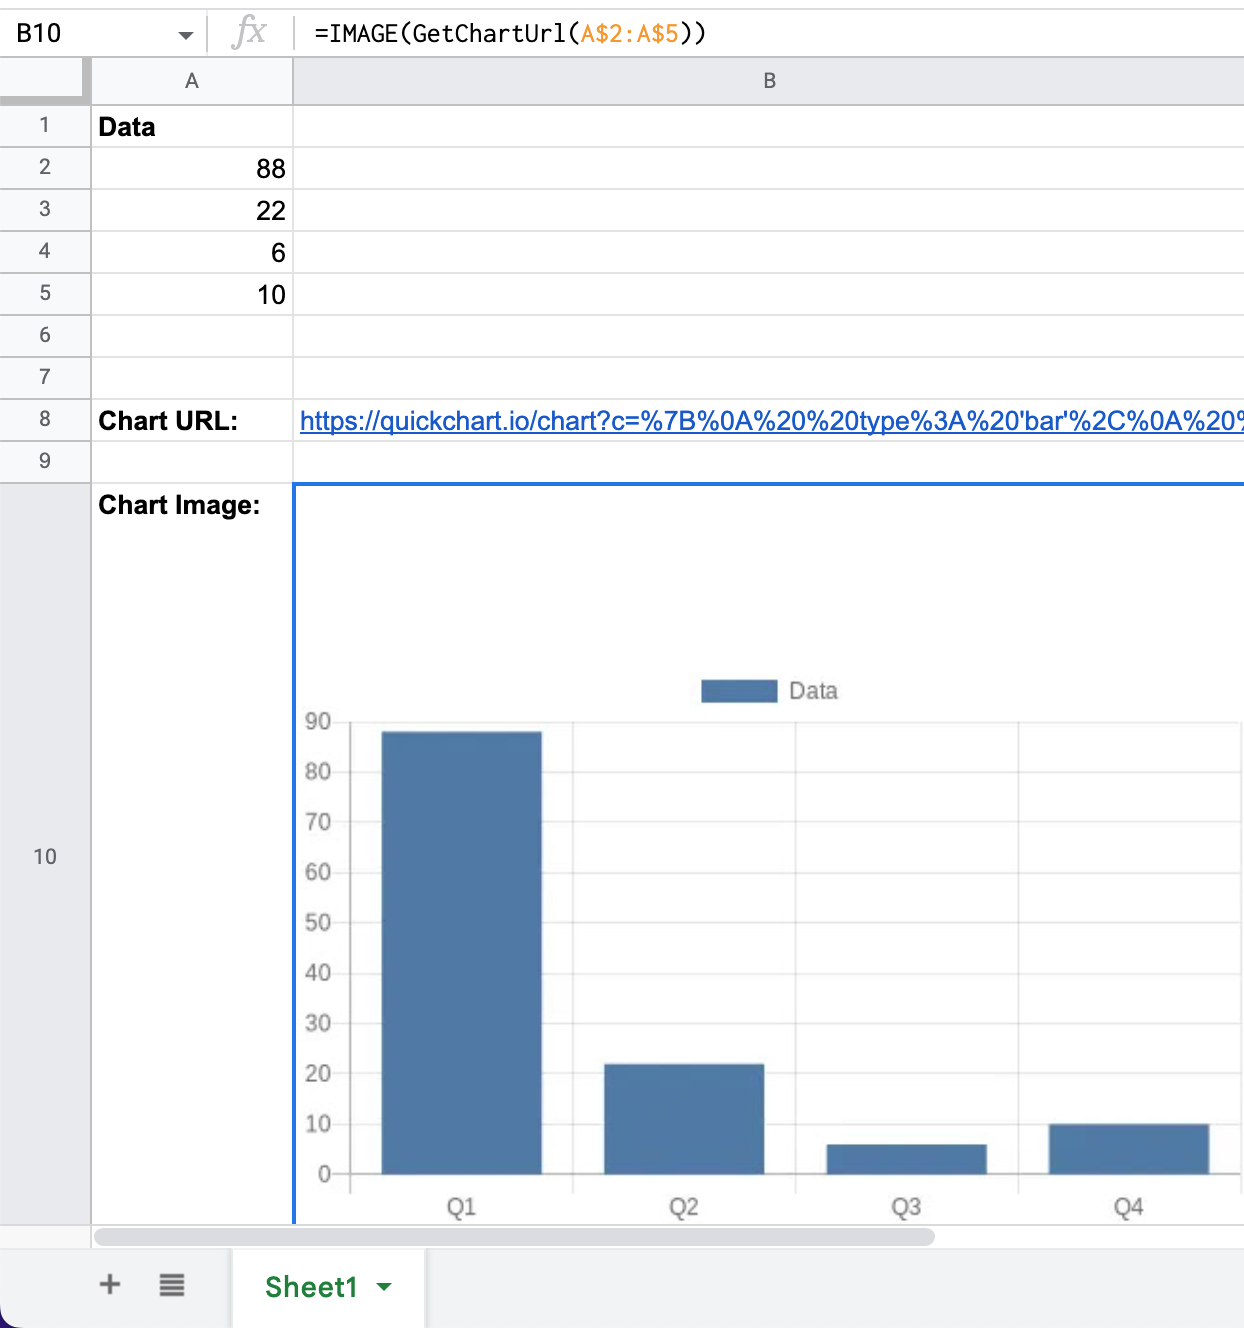
Use the IMAGE() function render the URL as an image:
=IMAGE(GetChartUrl(A2:A5))
Here's what it looks like:
See this example sheet which generates a chart URL: https://docs.google.com/spreadsheets/d/1cOjoT4viETplmdTvNOeDKVjwIqZpIr2afMCiK7vgQLY/edit#gid=0
Customize the chart
QuickChart is based on Chart.js, the most popular open-source chart library. You can customize chart type, size, colors, labels, and more.
Learn more about the QuickChart API or view chart examples.
