Server-side image rendering for Google Charts
This post goes into detail on Google Charts Node, an open-source project that renders Google Charts as images.
This may be useful if you can't create the chart on a browser client (e.g. for emails or reports) or if you want to let users download chart images.
Google Charts Node can be used as a library or a hosted web API. It works on the server using headless browser rendering. As a result, it can render any Google Chart - including ones that don't support getImageURI!
Installation
Google Charts Node is available on NPM and can be installed with:
npm install google-charts-node
Example
Here's an example of how to render a chart on the server side with Node.js:
const GoogleChartsNode = require('google-charts-node');
// Define your chart drawing function
function drawChart() {
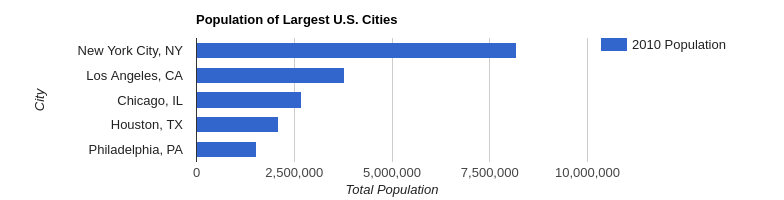
const data = google.visualization.arrayToDataTable([
['City', '2010 Population'],
['New York City, NY', 8175000],
['Los Angeles, CA', 3792000],
['Chicago, IL', 2695000],
['Houston, TX', 2099000],
['Philadelphia, PA', 1526000],
]);
const options = {
title: 'Population of Largest U.S. Cities',
chartArea: { width: '50%' },
hAxis: {
title: 'Total Population',
minValue: 0,
},
vAxis: {
title: 'City',
},
};
const chart = new google.visualization.BarChart(container);
chart.draw(data, options);
}
// Render the chart to image
const image = await GoogleChartsNode.render(drawChart);
Because Google Charts Node uses Google's Javascript libraries to render the image, results are the same as regular Javascript Google Charts. The above example produces this image:
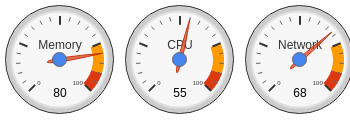
It works for any chart type, including ones that do not typically have image support:

Passing in arguments
To use outside values in your drawChart function, you must pass a Javascript string to render. This is because drawChart is passed as a string to the chart renderer under the hood.
Here's an example:
const myArg = 12345;
const myOtherArg = [5, 10, 15, 20];
const drawChartStr = `
  // Create the data table.
  var data = new google.visualization.DataTable();
  data.addColumn('string', 'Topping');
  data.addColumn('number', 'Slices');
  data.addRows([
    ['Mushrooms', ${myArg}],
    ['Onions', ${myOtherArg[0]}],
    ['Olives', ${myOtherArg[1]}],
    ['Zucchini', ${myOtherArg[2]}],
    ['Pepperoni', ${myOtherArg[3]}],
  ]);
  // Set chart options
  var options = { title: 'How Much Pizza I Ate Last Night' };
  // Instantiate and draw our chart, passing in some options.
  var chart = new google.visualization.PieChart(document.getElementById('chart_div'));
  chart.draw(data, options);
`;
const image = await GoogleChartsNode.render(drawChartStr, {
  width: 400,
  height: 300,
});
API parameters
The following parameters are accepted by the render function:
- code: Javascript contents of drawChart (required)
- packages: List of Google Visualization packages to load (defaults to
corechart) - width: CSS width of chart canvas (defaults to
100%) - height: CSS height of chart canvas (defaults to
100%) - mapsApiKey: Optional maps key for geochart and map chart types
Using the API
You can use google-charts-node yourself in your node application or as a standalone server.
Or, you can use the hosted version on QuickChart and invoke it from any application. The hosted API endpoint is https://quickchart.io/google-charts/render.
GET request
To construct your API request, URL-encode your drawChart Javascript code and pack it into the URL. Here's an example:
https://quickchart.io/google-charts/render?packages=timeline&code=var container = document.getElementById('timeline');var chart = new google.visualization.Timeline(container);var dataTable = new google.visualization.DataTable();dataTable.addColumn({ type: 'string', id: 'President' });dataTable.addColumn({ type: 'date', id: 'Start' });dataTable.addColumn({ type: 'date', id: 'End' });dataTable.addRows([[ 'Washington', new Date(1789, 3, 30), new Date(1797, 2, 4) ],[ 'Adams', new Date(1797, 2, 4), new Date(1801, 2, 4) ],[ 'Jefferson', new Date(1801, 2, 4), new Date(1809, 2, 4) ]]);chart.draw(dataTable);You can include packages, width, height, and mapsApiKey in your query parameters as well.
POST request
For complex charts or larger charts, you'll definitely want to send a POST request because URLs can get messy. POST the parameters to the endpoint in JSON format.
Here's an example POST payload:
{
  "width": 600,
  "height": 300,
  "packages": "timeline",
  "code": "var container = document.getElementById('timeline');var chart = new google.visualization.Timeline(container);var dataTable = new google.visualization.DataTable();dataTable.addColumn({ type: 'string', id: 'President' });dataTable.addColumn({ type: 'date', id: 'Start' });dataTable.addColumn({ type: 'date', id: 'End' });dataTable.addRows([[ 'Washington', new Date(1789, 3, 30), new Date(1797, 2, 4) ],[ 'Adams', new Date(1797, 2, 4), new Date(1801, 2, 4) ],[ 'Jefferson', new Date(1801, 2, 4), new Date(1809, 2, 4) ]]);chart.draw(dataTable);"
}
A request in Python would look like this:
resp = requests.post('https://quickchart.io/google-charts/render', json={
    'width': 600,
    'height': 300,
    'packages': '...',   # optional
    'code': 'var chart = ...',
})

with open('chart.png', 'wb') as f:
    f.write(resp.content)
And in Javascript:
const headers = new Headers();
headers.append('Content-Type', 'application/json');

const body = JSON.stringify({
  width: 600,
  height: 300,
  packages: '...',
  code: '...',
});

const requestOptions = {
  method: 'POST',
  headers,
  body,
};

fetch('https://quickchart.io/google-charts/render', requestOptions)
  .then((response) => response.text())
  .then((result) => console.log('Got', result.length, 'bytes'))
  .catch((error) => console.error(error));
Need help?
The Google Charts render API is still being developed! Email me or post on the Github if you have questions.
