How to send Chart.js in emails
Chart.js is a best-in-class library that does a great job rendering charts for the browser. But emails can't contain Javascript, only static HTML.
If you want to send emails that contain Chart.js charts, you'll have to render them as images.
Because Chart.js is a Javascript library, the image requirement means you'll have to jump through a few hoops:
- Render the charts on a backend capable of executing Javascript
- Upload the rendered chart image somewhere
- Send an email containing the image
You may also be interested in other ways to render Chart.js images.
Option 1: Use a library to export your Chart.js image
Libraries like chartjs-to-image can be used to export Chart.js as an image on the server side.
You can attach or embed this image in your email. Here's a simple example:
const ChartJsImage = require('chartjs-to-image');

// Generate the chart
const chart = new ChartJsImage();
chart.setConfig({
  type: 'bar',
  data: { labels: ['Hello world', 'Foo bar'], datasets: [{ label: 'Foo', data: [1, 2] }] },
});
Now that the chart image has been generated, send it in an email using Sendgrid:
const sgMail = require('@sendgrid/mail');
sgMail.setApiKey('your_api_key_here');
// Embed the chart image directly in the email
const message = `Hi everyone,
<br><br>
Check out my chart:
<br><br>
<img src="${chart.toDataUrl()}" />
`;
// Send the message
const msg = {
to: '[email protected]',
from: '[email protected]',
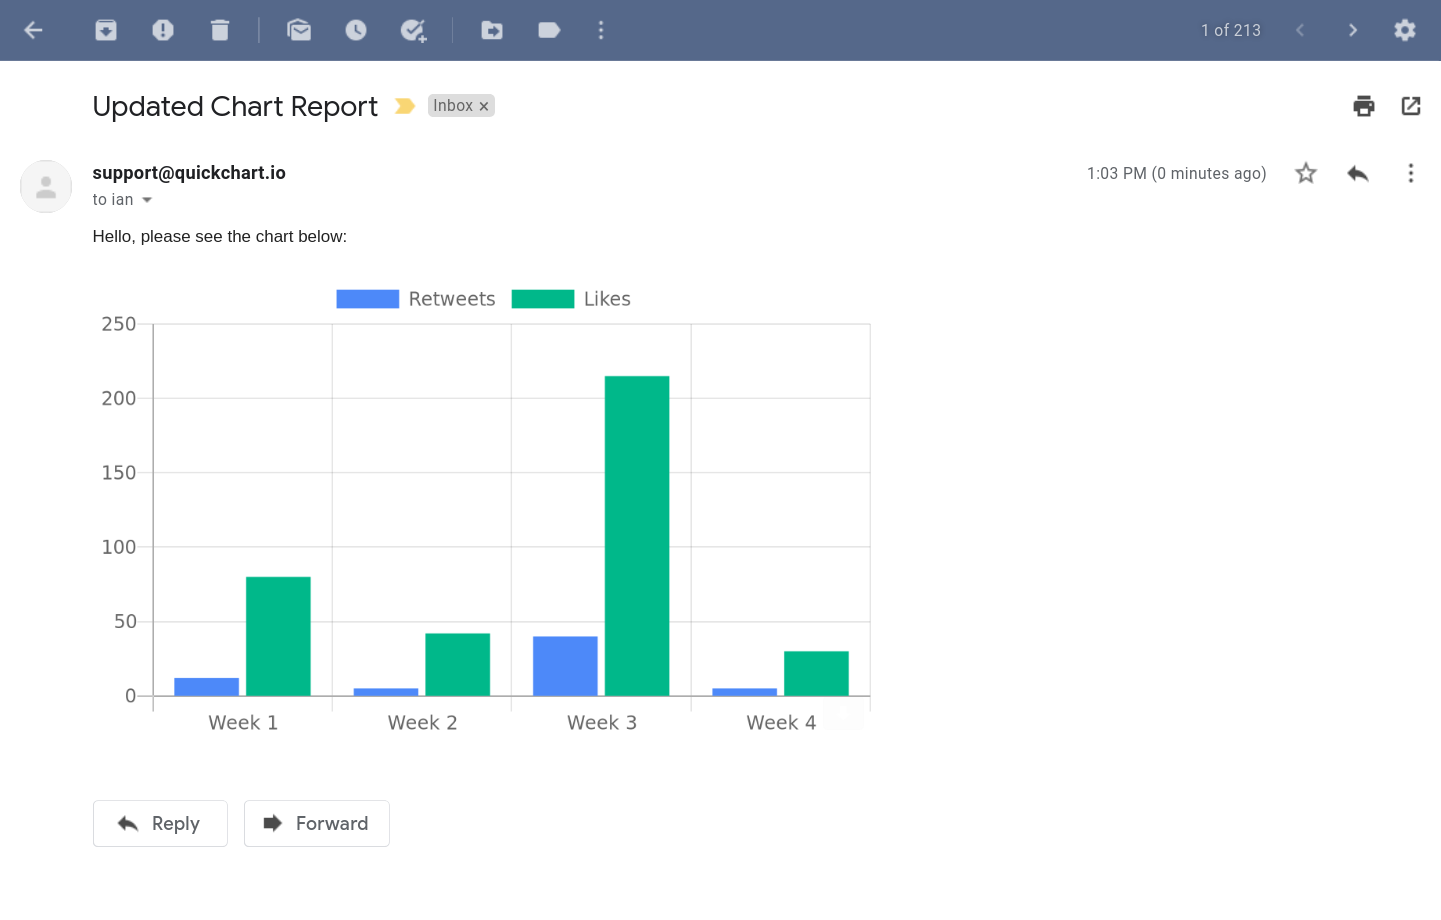
subject: 'Updated Chart Report',
html: message,
};
sgMail.send(msg);
Option 2: Render the chart with a headless browser
Libraries like Puppeteer solve the rendering problem by using the Chrome web browser to render a webpage that includes a chart.
In order to do this in Puppeteer, set up a page with your Chart.js bundle and take a screenshot of the canvas element.
async screenshotChart(chartConfig) {
  // Set up the browser and the page.
  const browser = await puppeteer.launch();
  const page = await browser.newPage();

  await page.setContent(
    `<!DOCTYPE html>
    <html>
      <body>
        <canvas id="chart-canvas" width="${width}" height="${height}"></canvas>
      </body>
    </html>`
  );

  await page.addScriptTag({
    path: '/path/to/Chart.bundle.min.js')
  });

  const canvas = await page.$('#chart-canvas');

  // Render the chart.
  await page.evaluate((canvas, config) => {
    const ctx = canvas.getContext('2d');
    const chart = new Chart(ctx, config);
  }, canvas, chartConfig);

  // Take a screenshot.
  const image = await canvas.screenshot({
    omitBackground: true
  });

  return image;
}
This is a fine solution for small-scale rendering. There are two problems:
- Puppeteer is resource-intensive. You'll need a machine with enough RAM to run a headless web browser and all its dependencies. In general, it takes a lot of work to set up a robust render farm that can stay online and process lots of charts efficiently.
- You may run into issues with sizing, blurriness, and viewport resolution.
- Depending on performance requirements, you may to store the generated images and expire them as necessary.
Usually it's easier to go with a dedicated render API that saves you the trouble of having to set up and maintain rendering infrastructure yourself. Which brings us to...
Option 3: Render the chart with a chart image API
QuickChart is an open-source API that renders Chart.js charts as images. Send it a request with your Chart.js config and it will return your rendered chart. This does not require any dependencies other than making an HTTP request.
The main QuickChart endpoint is https://quickchart.io/chart. Use this as a base URL, then provide some query parameters:
chartorc: The Chart.js object (required)width: Width of chart in pixels (optional)height: Height of chart in pixels (optional)devicePixelRatio: Ratio between physical pixels and logical pixels. Defaults to 2.0 for retina support (optional)- View more parameters in the documentation
Take this Chart.js config for example:
{
  type: 'bar',
  data: {
    labels: [2012, 2013, 2014, 2015, 2016],
    datasets: [{
      label: 'Users',
      data: [120, 60, 50, 180, 120]
    }]
  }
}
Place the config into the URL:
https://quickchart.io/chart?c={type:'bar',data:{labels:[2012,2013,2014,2015,2016],datasets:[{label:'Users',data:[120,60,50,180,120]}]}}Now, place this URL in an image tag within an HTML email body:
<img src="https://quickchart.io/chart?c={type:'bar',data:{labels:[2012,2013,2014,2015,2016],datasets:[{label:'Users',data:[120,60,50,180,120]}]}}" />And you'll get a chart image:
You can safely embed this chart directly in your email. It doesn't require any Javascript, and anyone with an email client that can show images will be able to see your chart.
For more advanced usage and many other chart types and customization, view the documentation.
Need more help? Ask questions in our community.
