How to send charts and graphs with a Discord bot
Discord bot messages are limited by the Discord API to specific formats: text (markdown), image attachments, and embeds. Because bots can't use Javascript or other dynamic tools, many charting libraries cannot be used.
As a result, you must render a chart or graph as an image in order to send it on Discord.
In this tutorial we'll use the free and open-source QuickChart API to generate chart images. To send these charts to Discord, you must:
- Construct the chart image
- Include it in your Discord bot's message
This tutorial is written assuming you are using Javascript (discord.js), but the approach is general and will work for any language.
The QuickChart API uses Chart.js config, which are mostly JSON and can be built in any programming language. See QuickChart documentation for instructions on how to build in your preferred language.
Create a chart image
If you're already showing your chart on a web frontend, your work here might already be done because QuickChart is built on top of Chart.js. You can just use your existing Chart.js config.
If you haven't already built with Chart.js, don't worry. All we need to do is construct a Chart.js config object.
For example, imagine we have the following data:
| Retweets | Likes |
|---|---|
| 12 | 80 |
| 5 | 42 |
| 40 | 215 |
| 5 | 30 |
First, let's create our Chart.js config (learn more about customizing your charts at the Chart.js docs):
const chart = {
  type: 'bar',
  data: {
    labels: ['Week 1', 'Week 2', 'Week 3', 'Week 4'],
    datasets: [
      {
        label: 'Retweets',
        data: [12, 5, 40, 5],
      },
      {
        label: 'Likes',
        data: [80, 42, 215, 30],
      },
    ],
  },
};
This config sets up two data series, Retweets and Likes, and their associated values. The X axis is labeled Weeks 1-4.
Next, convert the JSON chart specification into a string:
const encodedChart = encodeURIComponent(JSON.stringify(chart));
And put the encoded chart into a QuickChart URL:
const chartUrl = `https://quickchart.io/chart?c=${encodedChart}`;
The result is a URL that encodes the chart object. If you were to set this URL as the src on an image tag, or simply send it in a message on Discord, you'd see the following:
To learn more about static chart rendering:
- Customize your chart using the Chart.js library
- Adjust rendering parameters using the QuickChart documentation
- Use the live chart editor to confirm your chart will look exactly the way you want.
Use a library
There are a handful of libraries that will build chart URLs for you and also provide advanced features like short URLs.
Check out quickchart-js for Javascript. There are many other libraries for other languages, including Python, Java, C#, Ruby, PHP, and more. See the client libraries list for more.
The Javascript library can be installed via npm install quickchart-js and lets you easily construct and customize charts:
const QuickChart = require('quickchart-js');

const chart = new QuickChart();
chart
  .setConfig({
    type: 'bar',
    data: { labels: ['Hello world', 'Foo bar'], datasets: [{ label: 'Foo', data: [1, 2] }] },
  })
  .setWidth(800)
  .setHeight(400);

// Print the chart URL
console.log(chart.getUrl());
Send the chart to Discord
Now that we've generated the URL for our chart, let's send it to Discord. We're going to use discord.js, but every Discord client library should be able to send a chart.
There are three ways to send images:
- Include a chart URL in a regular message
- Add the chart URL in an embed
- Upload the chart as a file attachment
QuickChart already supports chart image URLs, so let's just provide the URL directly to Discord. This is best because uploading the chart as an attachment to every message is slow and unnecessarily duplicates the image.
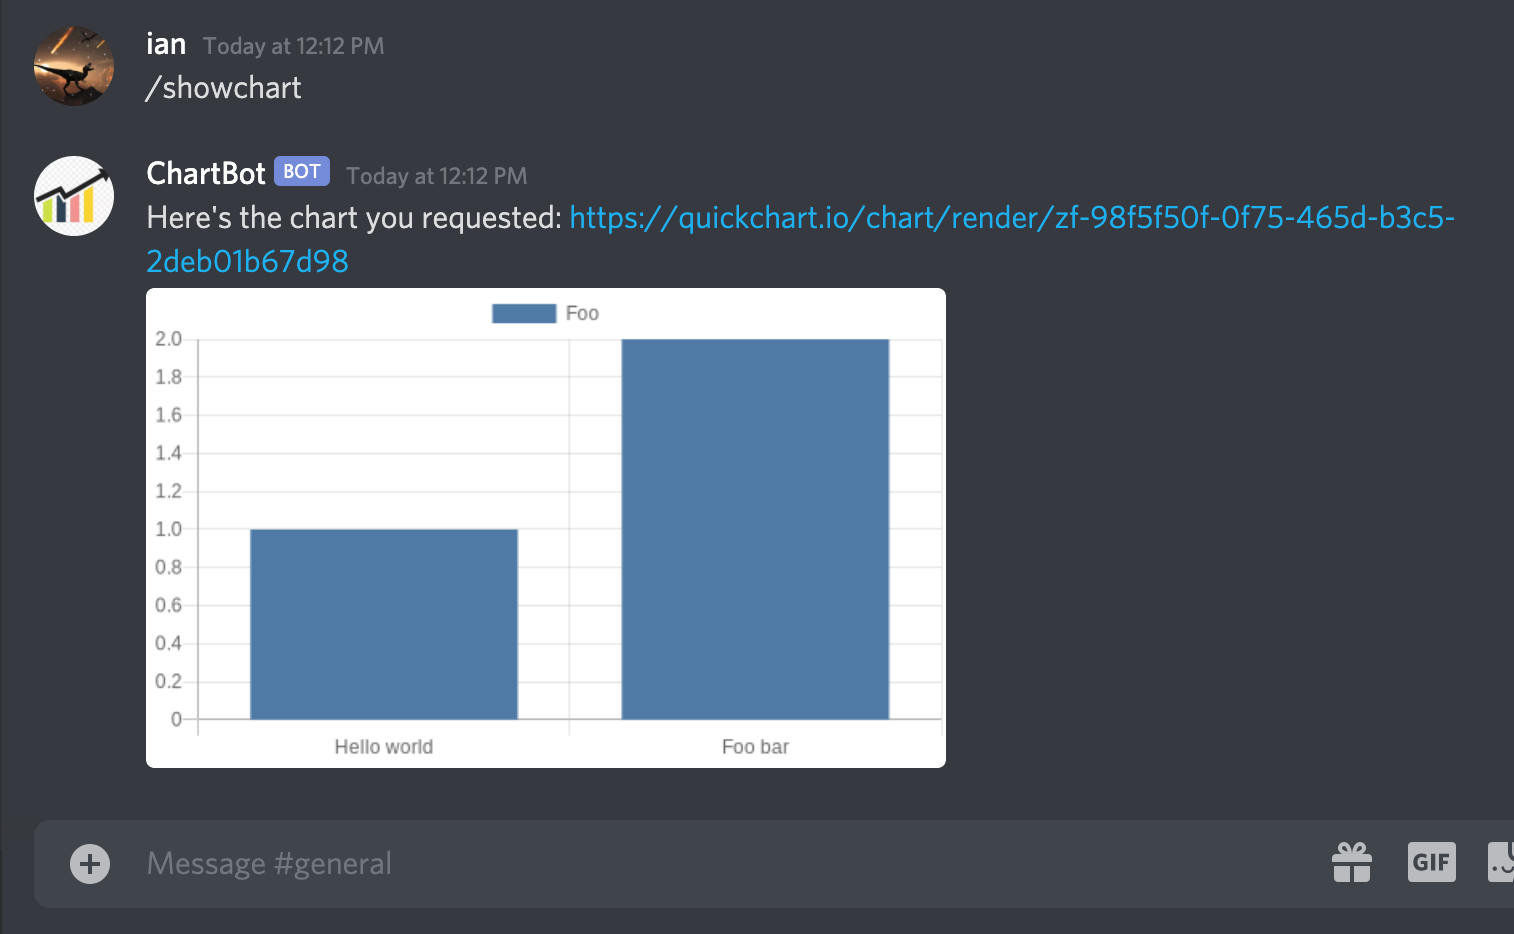
With approach #1, we simply include the URL directly in a message. You can include the regular QuickChart URL, but if your chart is large (URL longer than 2000 characters), you can use short URLs instead:
const Discord = require('discord.js');
const QuickChart = require('quickchart-js');

// Create the chart
const chart = new QuickChart();
chart.setConfig({
  type: 'bar',
  data: { labels: ['Hello world', 'Foo bar'], datasets: [{ label: 'Foo', data: [1, 2] }] },
});

// Send the chart
const client = new Discord.Client();
client.on('message', async (msg) => {
  if (msg.content === '/showchart') {
    const url = await chart.getShortUrl();
    msg.channel.send(`Here's the chart you requested: ${url}`);
  }
});
client.login(BOT_TOKEN);
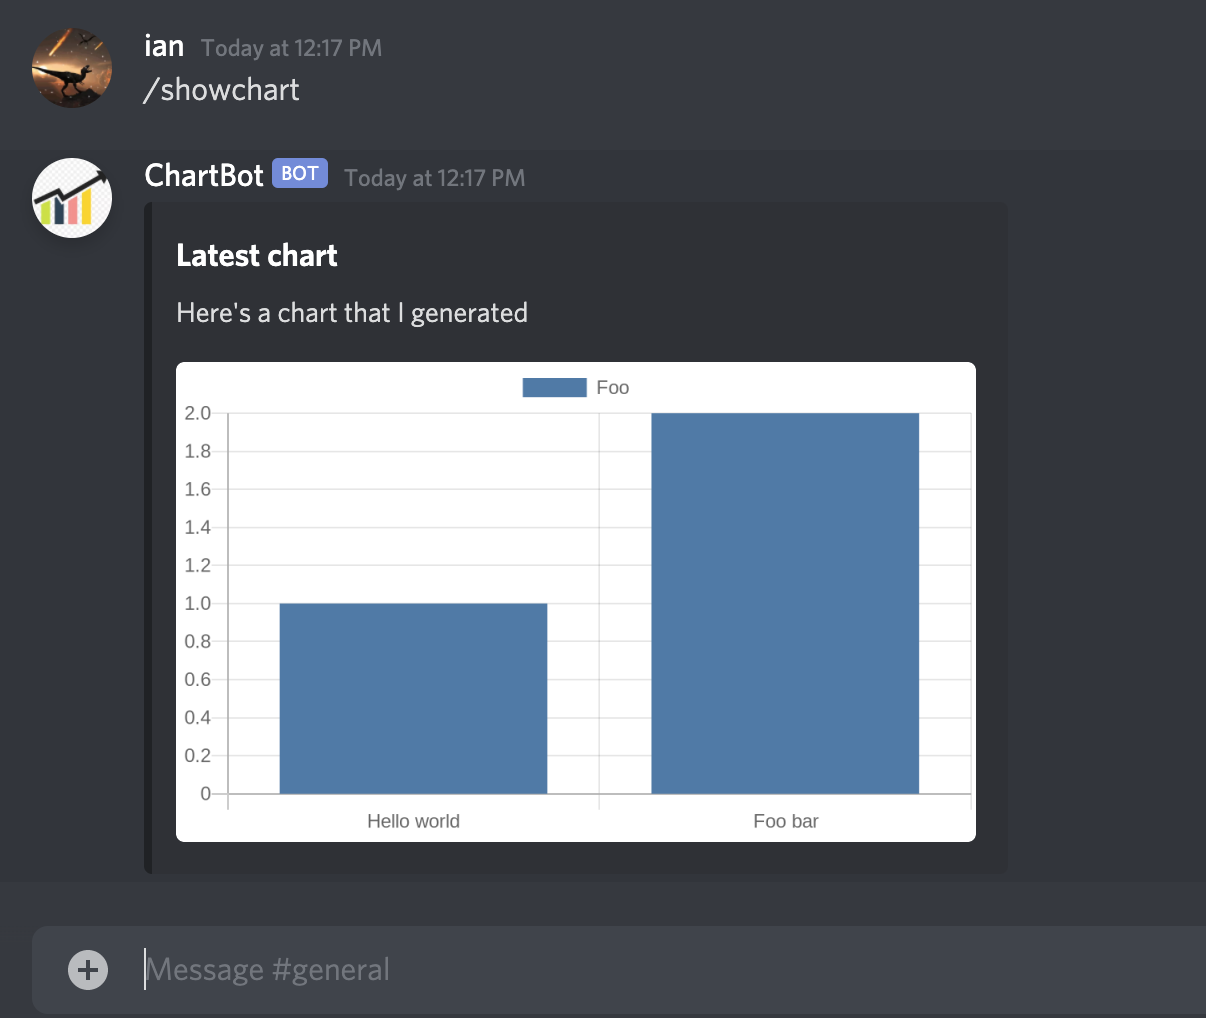
Approach #2 uses embeds, which will display your chart more neatly instead of relying on URL expansion.
const chartEmbed = {
  title: 'Latest Chart',
  description: "Here's a chart that I generated",
  image: {
    url: chart.getUrl(),
  },
};
msg.channel.send({ embed: chartEmbed });
Either approach is valid, it's just a matter of preference. URLs can be used in places where embeds are not allowed, such as in slash command/interaction responses.
Questions?
If you have questions about customizing your chart to look exactly how you want, first make sure you've understood the Chart.js documentation (Chart.js is separate from QuickChart, which just handles the rendering).
If you have a question about QuickChart and its rendering or library support, check out the QuickChart documentation.
You can also ask in our community, which we monitor every day.
If you're still stuck, feel free to email QuickChart support or contact me directly on Discord at ian#6538.
