Colors and backgrounds
Every aspect of chart coloration is customizable. All colors are taken as strings, in either hex, RGB, or by specifying a color name. To adjust opacity, set an RGBA value.
Chart background color
To color the chart background, set the backgroundColor query parameter to fill the entire chart background. See API parameters.
Data series colors
To color data series, set the borderColor and backgroundColor properties on each dataset in your chart (datasets are defined in data.datasets in the chart configuration object).
The default color palette is based on Tableau's and is carefully designed to work well together yet remain distinct and friendly to conditions such as color blindness.
If you are using Chart.js v2, you may specify select color schemes from the Chart.js colorschemes plugin, which offers predefined and well-known color schemes.
Font and label colors
To customize font and label colors, see font customization.
Gridlines and axes colors
To customize gridline and axis colors, reference gridlines documentation.
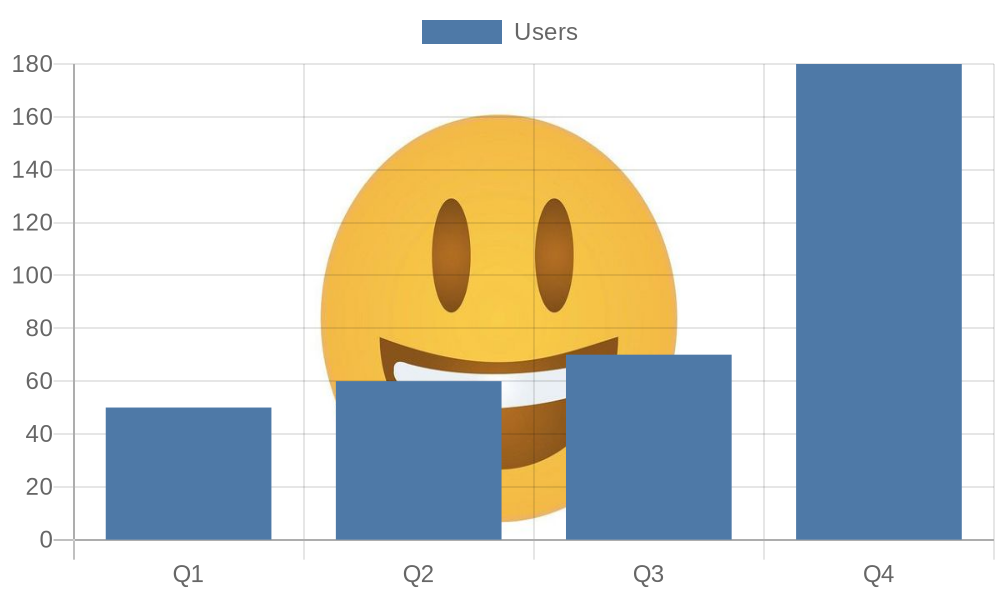
Background image
To use a custom background image, use the backgroundImageUrl plugin.
The image must be publicly available on the web, load within 5 seconds, and be in png, jpg, gif, bmp, tiff, svg, or webp format:
// ...
options: {
  plugins: {
    backgroundImageUrl: 'https://example.com/image.png';
  }
}
Here's a live example:
Gradient fills
To add a gradient fill, use getGradientFillHelper(direction, colors, dimensions)
| Parameter | Description |
|---|---|
| direction | The direction of the gradient. horizontal, vertical, or both. |
| colors | A list of colors that defines the gradient. Colors can be specified in named, hex, or rgb/rgba formats. |
| dimensions | Optional. An object with width and height parameters that defines the size of the gradient. |
Here's an example chart configuration:
More examples
For additional examples of coloration and backgrounds, see chart gallery - patterns and fills for gradients, patterns, background images, image fills, and more.
