QR Code analytics
Built-in scan analytics with dynamic QR codes
Dynamic QR codes track scans for you. Each code encodes a QuickChart scan link that records the scan and then redirects to your destination, so you don't need to add UTM parameters or set up an analytics tool.
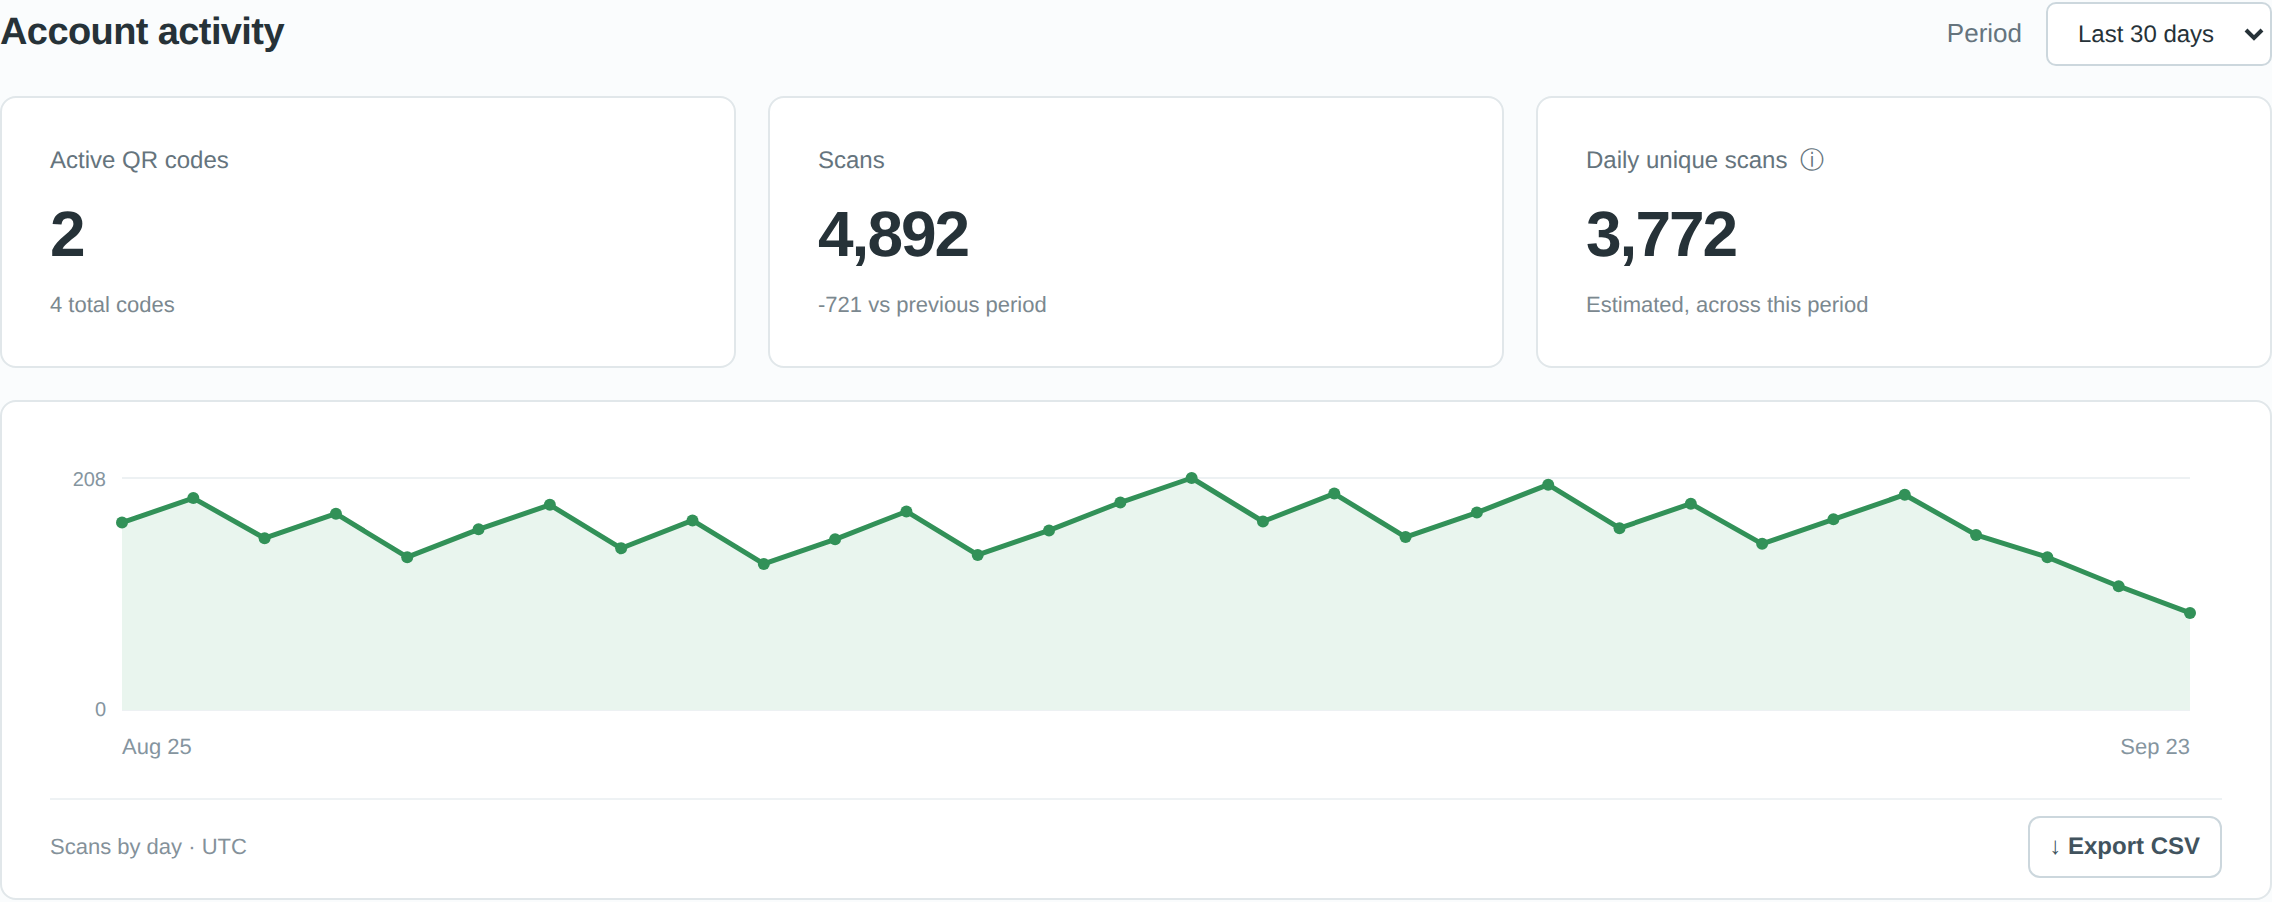
The dashboard shows scan activity for your whole account and for each code:
- Scans and daily unique scans over the last 7, 30, or 60 days, with a comparison to the previous period for 7- and 30-day views
- Scans by day (UTC) and, for each code, the time of the most recent scan
- Breakdowns for each code by country, region, city, device, browser, operating system, referring website, and destination website
You can export account or per-code activity as CSV. The analytics API returns the same data, plus your top codes, and can filter by campaign or tag to compare placements such as print, packaging, and in-store signage:
curl 'https://qr.quickchart.io/api/analytics?days=30&codeId=CODE_ID' \
  -H "Authorization: Bearer $QUICKCHART_API_KEY"
Known bots are excluded by default, and counts can be sampled or delayed. No tracking cookies or raw IP addresses are stored. For details on how scans are counted, see scan analytics. To look around without an account, try the interactive demo.
Scan analytics count visits to the scan link. If you also want to see what people do after they reach your site, add UTM parameters to the destination URL as described below.
How to measure QR code usage
QuickChart's static QR codes integrate with third-party analytics like Google Analytics and Mixpanel. This enables you to track QR code scans and measure campaign performance.
To track QR scans, use UTM parameters, a common tracking standard supported by third-party analytics tools. UTM parameters are tags that you can add to a URL to track the source, medium, campaign, and other information about traffic coming to your site.
By adding UTM parameters to your QR code URLs, you can track the success of your QR code campaigns in your existing analytics workflow.
This page describes how to set up your analytics tool to analyze QR code traffic:
- Add UTM parameters to your QR code URLs.
- Use your preferred third-party analytics tool to measure UTM performance.
Step 1: Add UTM parameters to QR Code URLs
There are 3 UTM parameters you can use:
utm_source: Identifies the source of traffic to a website or app, such as a search engine or social media network. In this case, it could be something likeQR_Code1.utm_campaign: Identifies the specific campaign or promotion that the traffic is associated with. In this case, it could be something likeWinter_Sale.utm_medium: Identifies the type of traffic, such as email, CPC, or referral. In this case, could bedigital,print, or you can just omit it.
You can omit parameters that you don't need, but it makes sense to at least set utm_source.
Here's an example of a QR code URL with UTM parameters:
https://quickchart.io/qr?text=https://example.com&utm_source=QR_Code1&utm_campaign=Winter_Sale&utm_medium=print
In the example above, "QR_Code1" is the source of the traffic, "print" is the medium, and "Winter_Sale" is the campaign. Customize these parameters to fit your specific tracking needs.
Step 2: View analytics
UTM query parameters are a common marketing tool and are supported by all analytics programs. If your analytics platform is not listed below, refer to your analytics documentation or contact us.
Google Analytics
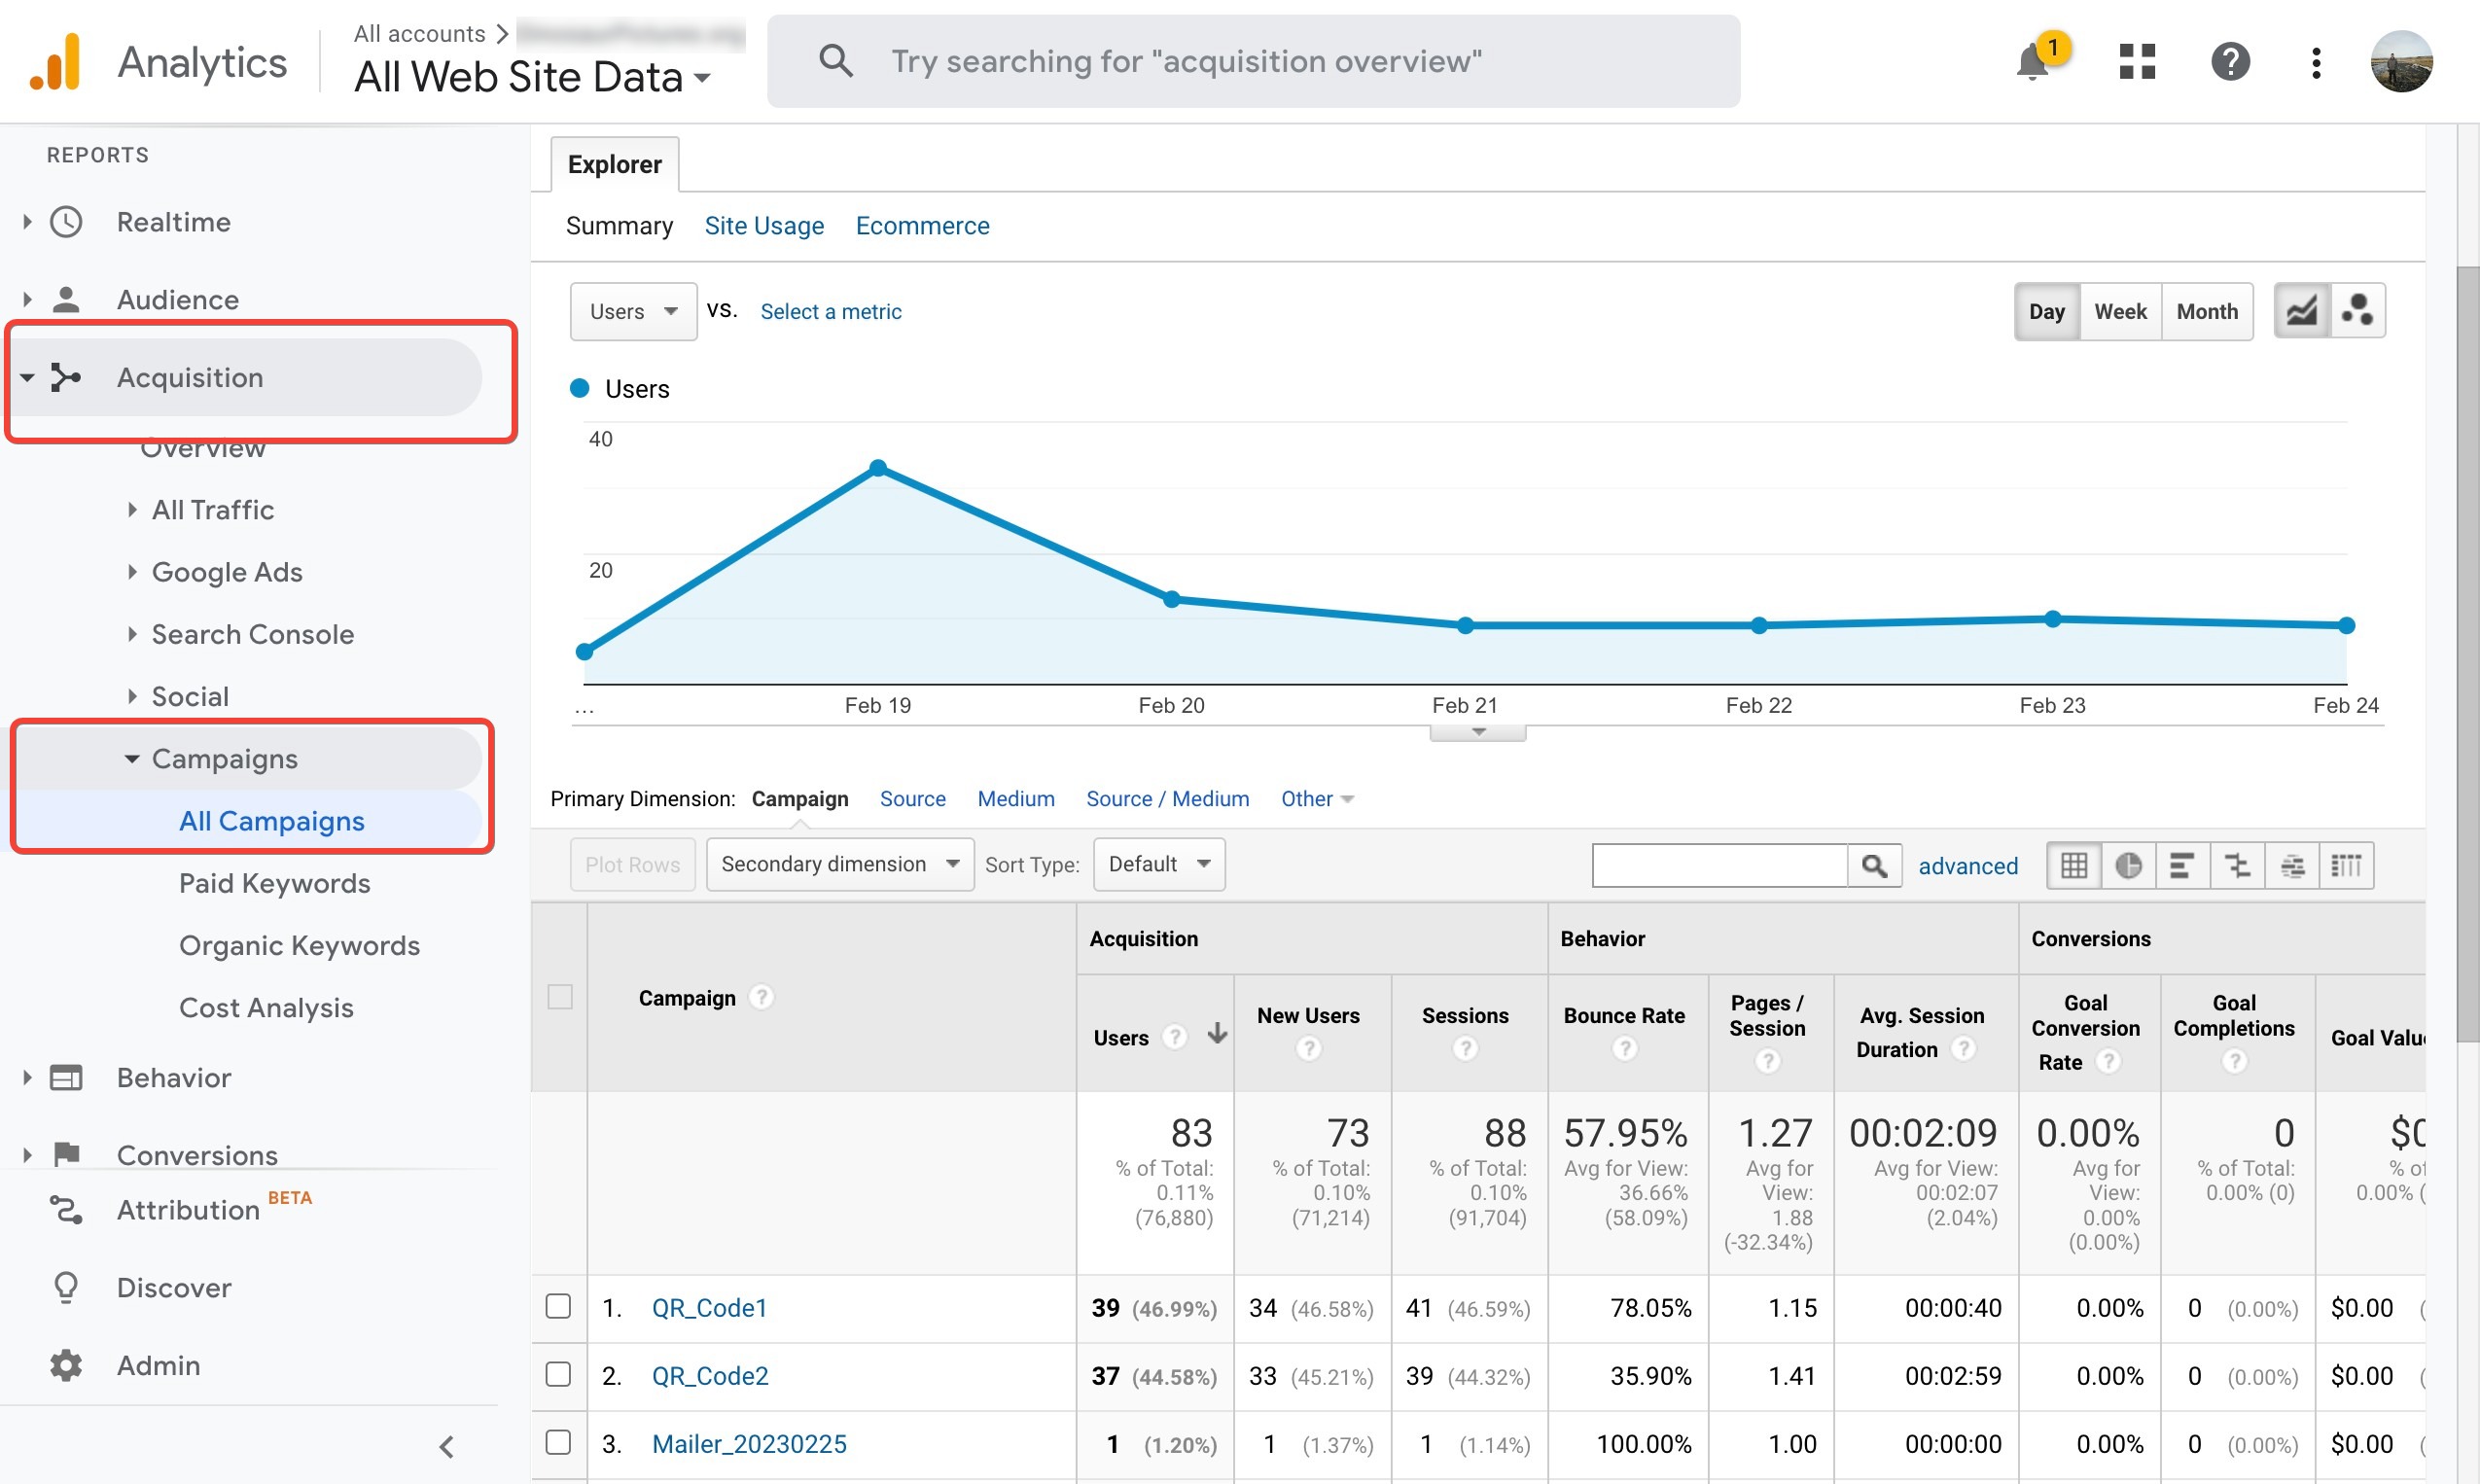
To find your UTM-tagged data in Google Analytics, go to Acquisition > Campaigns > All Campaigns.
Learn more about how to set up and view custom UTM campaign data in Google Analytics here.
Mixpanel
Use Mixpanel's insight view to break down traffic by the desired UTM parameter. Mixpanel has written an article on this topic here.
Adobe Analytics
Learn more about how to configure Adobe Analytics for UTM parameters here.
Why use third-party analytics?
Tracking QR code scans with a third-party analytics tool using UTM parameters is beneficial for these reasons:
- More comprehensive and customizable: These tools have advanced tracking capabilities that can provide detailed information about user behavior on your site, including follow-up pageviews, time on site, and conversion rates.
- Easier integration with other data sources: Connect your QR scan data with other data sources, such as website or app data, to gain a more holistic view of user behavior.
Conclusion
Adding UTM parameters to your QR code URLs is an easy way to learn how your QR code users are behaving once they scan.
QuickChart's QR code capability makes it easy to generate customized QR codes with UTM parameters, enabling businesses to measure the effectiveness of their marketing efforts using their existing analytics suite.
Need help? Don't hesitate to contact us.