Add charts to emails, reports, and anywhere else. Over 4 billion charts rendered for users around the world.
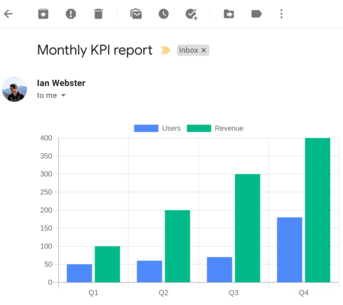
https://quickchart.io/chart?c={type:'bar',data:{labels:['Q1','Q2','Q3','Q4'], datasets:[{label:'Users',data:[50,60,70,180]},{label:'Revenue',data:[100,200,300,400]}]}}
⇣
Embed charts anywhere. Our chart API generates chart images, QR codes, and more.
Highly customizable. We're built on Chart.js, the most popular open-source charting library. We'll render any Chart.js configuration.
Easy to use.
Start by putting your Chart.js definition in a URL:
https://quickchart.io/chart?c={your chart here}
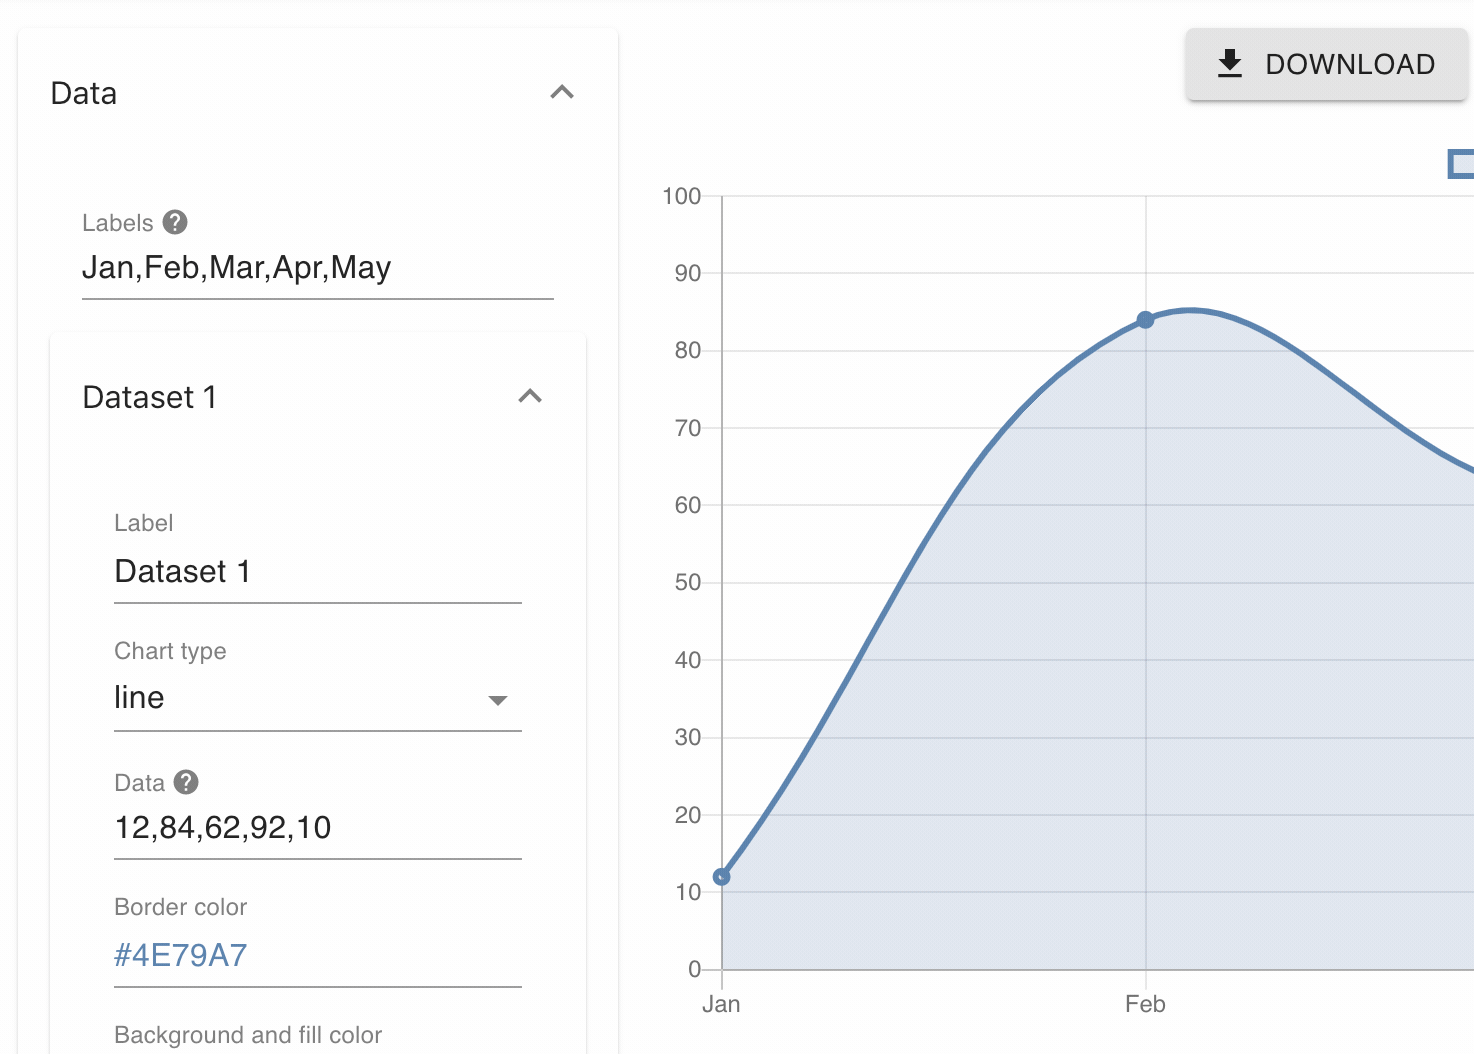
No-code support. Not technical? No problem. Design your chart using the Chart Maker, Zapier, or Make.
Trusted by developers and marketers around the world


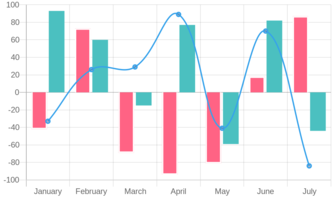
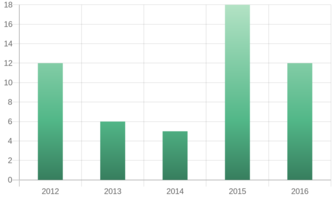
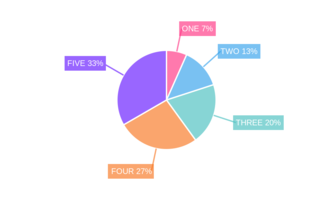
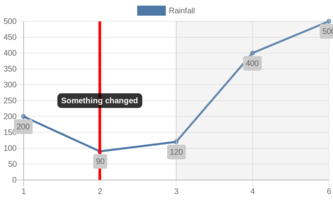
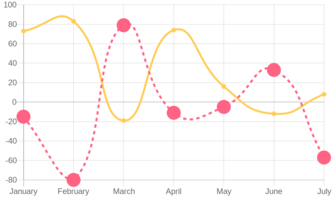
Let's get creative! You can use all static customization options available in Chart.js. Visit our chart gallery to see different chart types and plugins: bar charts, line graphs, pie charts, and much more.
QuickChart easily integrates with many no-code tools. Click on a product to learn more.


Use our no-code chart maker to create custom chart templates that you can embed dynamically in spreadsheets, Airtable, Bubble, AppSheet, Thunkable, and many other no-code tools.
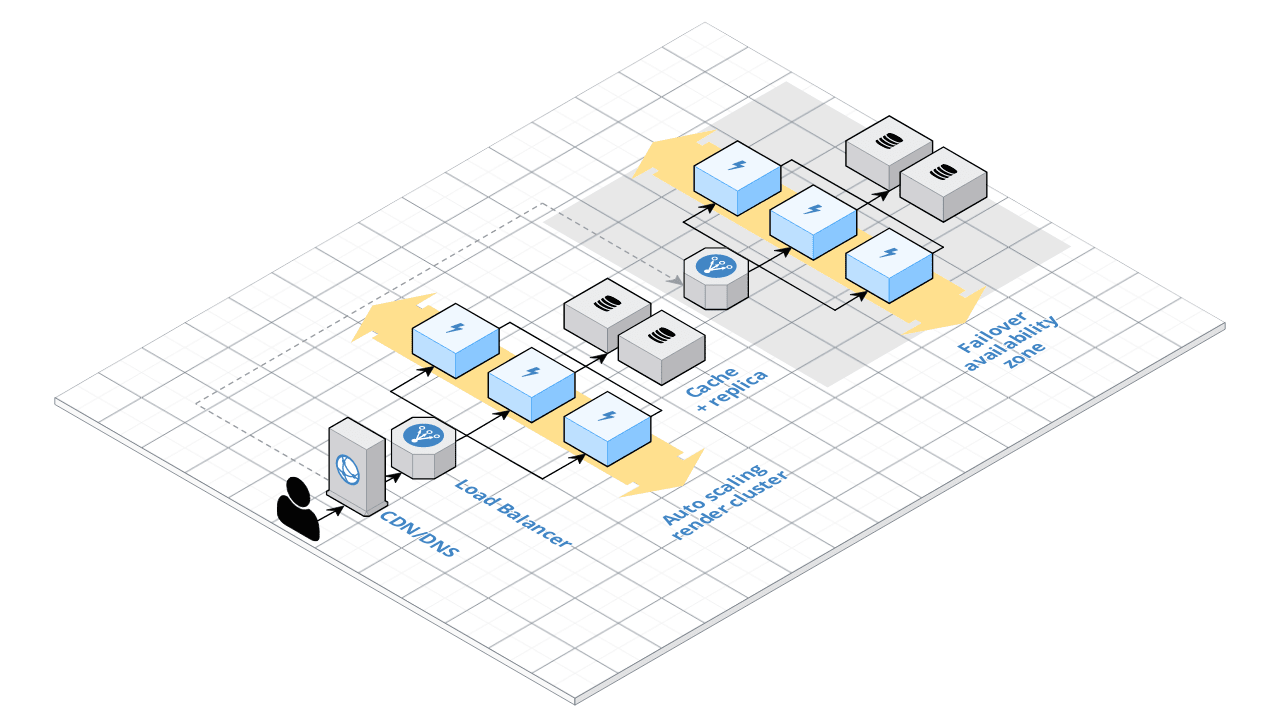
Rendering at scale is difficult and resource intensive. We've put a lot of working into taking care of the most difficult parts so you can focus on building your application.
Purchasing a license also grants permission to modify QuickChart for private and on-prem commercial use.
A chart is simply defined by its URL, so you can use our chart API in any programming language you like. And because our API produces images, you can include these charts nearly anywhere.
We support many languages and frameworks, including Python, Javascript/Node, Java, C#, and PHP.
Need help with development? Send us a message.
QuickChart is open source, dual licensed under the GNU AGPLv3 and a commercial license. You may use images produced by our API for any purpose.
Don't build your software on top of proprietary chart formats - use open source!